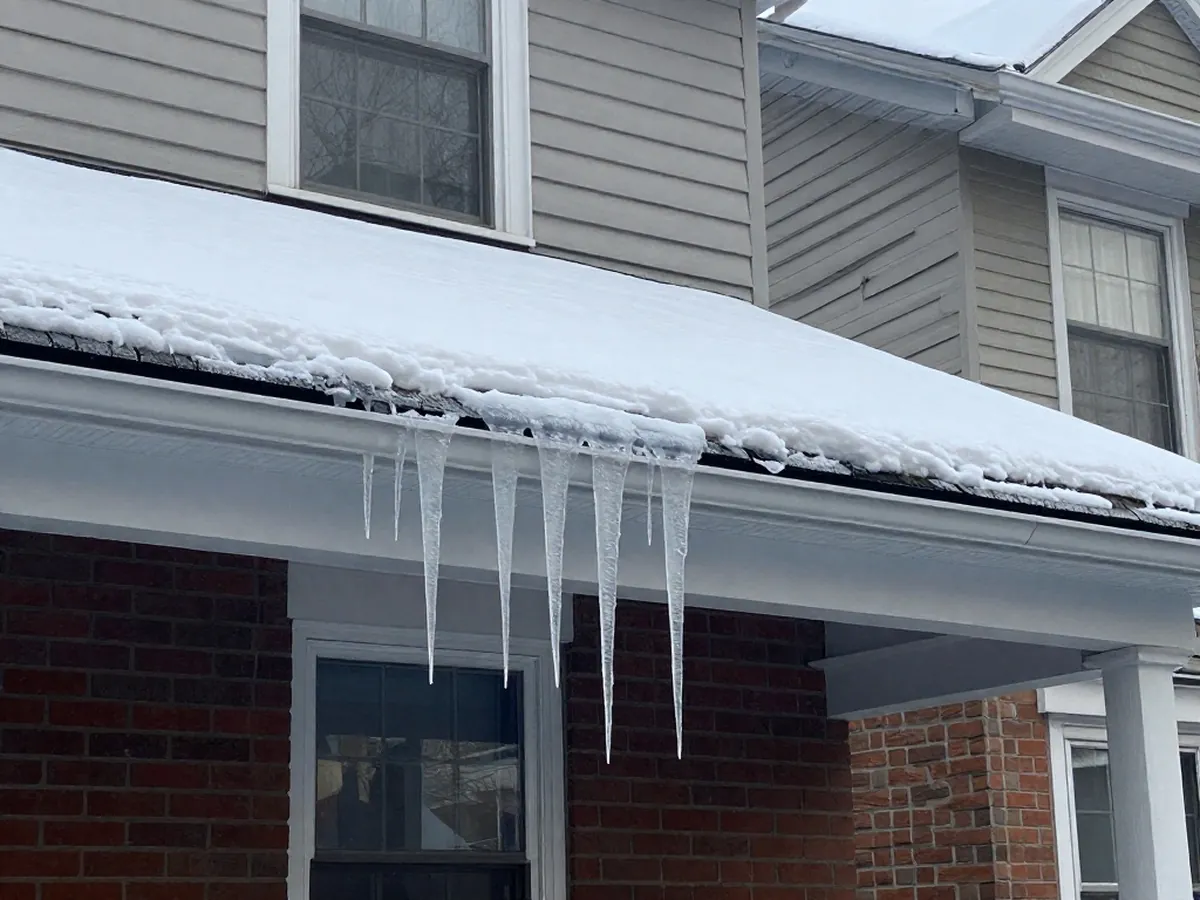
Where the numbers come from
The table below uses NOAA's 1991-2020 climate normals for the Teterboro Airport station, the closest one in the data used here. Normals are thirty-year averages, so any one January can be colder or milder than the table. The data file carries no snowfall normals, so the table leaves snow out.
The last column pairs each month with a roof note drawn from the pages in the source list.
Twelve months of Teterboro normals, with roof notes
| Month | Typical high and low (°F) | Rain (inches) | On the roof |
|---|---|---|---|
| January | 39.9 / 25.7 | 3.28 | Coldest month; ice forms at the eaves when the upper roof is above freezing and the edge is below it |
| February | 42.8 / 27.0 | 2.82 | Lows still under freezing; watch ceilings along outside walls for stains after a thaw |
| March | 50.6 / 34.0 | 4.09 | A good month for the first look from the ground |
| April | 62.5 / 43.7 | 3.97 | Gutters and downspouts after winter |
| May | 73.1 / 53.3 | 3.94 | Attic hatch check for damp insulation |
| June | 82.0 / 63.1 | 4.25 | A dry day for photographing every slope from the yard |
| July | 87.0 / 68.9 | 4.45 | Warmest month; look at flat roofs for standing water |
| August | 85.1 / 67.3 | 4.25 | Isaias, 4 August 2020: more than a million NJ customers lost power |
| September | 78.4 / 59.9 | 4.11 | Ida, 1 September 2021: 3.58 inches in an hour at Lyndhurst |
| October | 66.8 / 47.9 | 3.73 | Leaves reach the gutters; Sandy's storm summary is dated 29 October 2012 |
| November | 55.5 / 38.3 | 3.30 | Last easy look before the freezes |
| December | 44.9 / 30.8 | 4.10 | Wettest of the three winter months; lows near 31 degrees |
Winter: the freeze and the thaw
The University of Minnesota's extension service describes ice dams in one chain: heat escapes the house, the upper roof warms above freezing, snow melts, and the water refreezes at the colder eave. January's normal low of 25.7 degrees against a high of 39.9 gives Lyndhurst days on both sides of that line.
For new roofs, the state's ice-barrier bulletin applies its requirement to places averaging 25 degrees or below in January, and the only New Jersey area it names as meeting that test is Sussex County.
Spring: the first look from the ground
March brings 4.09 inches of rain on average, April 3.97 and May 3.94. Superstorm Sandy prompted the asphalt roofing trade group to advise owners to make the first check from ground level or an upstairs window, using binoculars. That advice works for any season, and spring is when winter's damage first shows.
A stain that appears after a spring downpour and spreads with the next one is worth a call to a roofer.
Summer: heat, downpours and falling limbs
June and August both carry a normal 4.25 inches of rain, July 4.45, with highs of 82.0, 87.0 and 85.1 degrees. Isaias, a tropical storm on 4 August 2020, knocked out electric service for upwards of a million New Jersey customers, a few of them for as long as five days, and the state weather network noted that countless trees came down.
PSE&G's advice for a limb tangled in a wire is to leave it alone and contact the utility. Past storms in the three towns are covered on the storm season page.
Fall: Ida, Sandy and the leaves
September's normal is 4.11 inches. On 1 September 2021 a Lyndhurst gauge logged 3.58 inches in one hour, with 9.02 inches for the storm at North Arlington and 8.72 at Harrison. Sandy's storm summary is dated 29 and 30 October 2012.
Leaves arrive in October and November, and Secaucus runs leaf pickup every Wednesday from 1 September to 31 December. A gutter packed with leaves shows from a window in seconds.
Which row of the table is today?
Match today's date to a row in the table, make the ground-level look the row suggests, and write the date beside any photograph.
When a stain follows a storm or a freeze, the storm damage repair and ice dam damage pages describe what a roofer looks at. Call (551) 209-3947 and say which month's weather you think did it.
From
- NOAA NCEI, 1991-2020 U.S. Climate Normals, monthly, Teterboro Airport NJ (USW00094741)
- University of Minnesota Extension, Dealing with and preventing ice dams (reviewed 2022)
- NJ Department of Community Affairs, Bulletin 07-3, Ice Dam Membrane/Ice Barrier (rev. June 2015)
- Asphalt Roofing Manufacturers Association, Assessing roof damage after Superstorm Sandy (7 Nov 2012)
- New Jersey Weather and Climate Network, The Beat Goes On: August 2020 and Summer Recaps (7 Sep 2020)
- New Jersey Weather and Climate Network, Remnants of Ida strike New Jersey
- PSE&G, Downed Power Line Safety
- Town of Secaucus, Department of Public Works
- Bergen County, 2026 Hazard Mitigation Plan, Section 4 Risk Assessment (Table 4.6-1)
Checked 1 Nov 2026